


What Percentage of Web Traffic Is Mobile? (2026 Statistics)
By Josh Ternyak

April 17, 2026
Mobile devices now account for approximately 64% of global web traffic in 2026. This comprehensive data guide covers mobile traffic share by region, industry, device type, and what the dominance of mobile means for website design, SEO, and business outcomes.
Key Statistics: Mobile Web Traffic in 2026
Mobile vs Desktop vs Tablet: Global Traffic Share
The shift of web traffic from desktop to mobile has been one of the defining trends of the internet for the past decade — and understanding where it stands in 2026, how it varies by context, and what it means for website owners requires moving beyond the single global average into the nuanced picture that industry and geographic data reveals.
The 64% mobile figure represents a global average that masks enormous variation. In some markets and industries, mobile dominates at 80%+. In others — particularly B2B technology, professional services, and certain desktop-centric work tools — desktop remains the majority traffic source. The strategic implications of mobile traffic depend entirely on which of these contexts your website operates in.
Global Mobile Traffic Share: Historical Trend
YearMobile Traffic %Desktop Traffic %Tablet %Key Milestone20116.1%90.6%3.3%Smartphone penetration accelerating201316.2%79.1%4.7%Mobile-friendly becomes SEO factor201535.1%58.2%6.7%Mobile surpasses desktop in search queries201651.3%44.0%4.7%Mobile first exceeds desktop for the first time201857.8%38.5%3.7%Google announces mobile-first indexing202059.5%37.1%3.4%COVID temporarily boosts desktop for work202260.9%36.2%2.9%Tablet continues decline202463.1%33.9%3.0%Mobile growth continues2026 (current)64.0%33.3%2.7%Gradual continued shift
The growth rate of mobile's share has slowed considerably. The dramatic rise from 6% in 2011 to 51% in 2016 reflected mass smartphone adoption — billions of people worldwide getting their first smartphone and accessing the web for the first time. By 2026, mobile penetration in most markets is near-saturated. The additional growth from 60% to 64% since 2020 reflects incremental behavioral shifts rather than new user adoption.
The future trajectory is unlikely to see mobile reach 80%+ globally because desktop retains structural advantages for certain high-engagement activities: longer-form content consumption, productivity tasks, e-commerce purchasing (where desktop conversion rates remain significantly higher), and complex research. The current 64% may represent a reasonably stable equilibrium for the near term.
Mobile Traffic Share by Region
RegionMobile Traffic ShareDesktop ShareNotesAfrica~77%~20%Mobile-only internet access dominantAsia-Pacific~72%~25%India (76%) and Southeast Asia drivingLatin America~68%~29%Brazil, Mexico strong mobile marketsMiddle East~70%~27%Saudi Arabia and UAE especially mobile-firstEurope~58%~38%Higher desktop usage than global avgNorth America~57%~39%Still strong desktop presence
The regional variation tells an important economic and infrastructure story. In markets where smartphones were people's first internet device — much of Sub-Saharan Africa, South and Southeast Asia — mobile traffic dominance is overwhelming because desktop internet access either doesn't exist or is only available in office settings. For businesses targeting these markets, "mobile-first" is not a design philosophy — it's the only relevant context for their entire digital presence.
North America and Europe show meaningfully higher desktop percentages than the global average, partly reflecting higher PC penetration and partly reflecting the nature of work-related internet use in knowledge economy jobs. A significant portion of the "desktop" traffic in these regions is office workers doing work-related research and transactions during business hours — which has implications for B2B businesses whose users are specifically at work computers.
Mobile Traffic Share by Industry
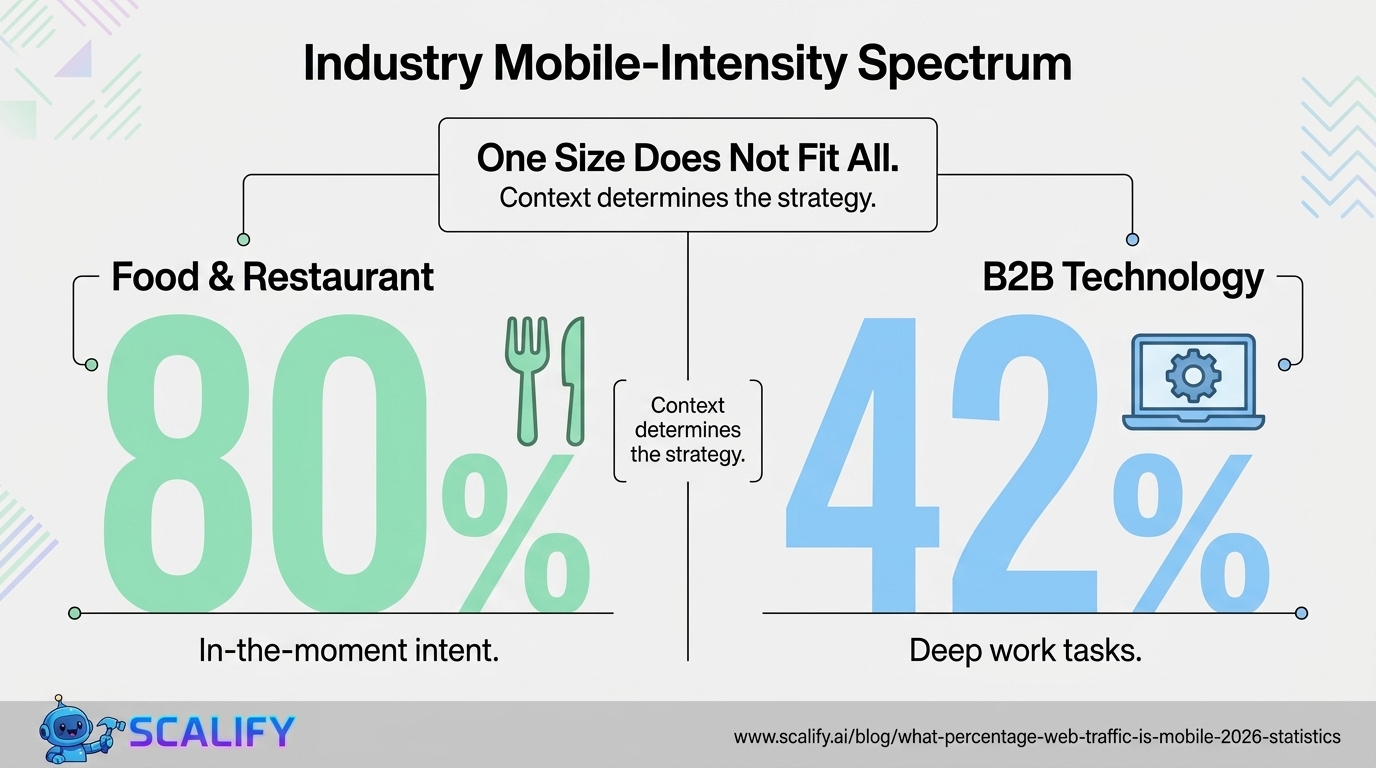
IndustryMobile Traffic %Desktop Traffic %ImplicationsNews & Media78%19%Mobile-first design essentialFood & Restaurant80%17%Dominated by in-moment mobile searchTravel & Tourism74%23%Research mobile, often convert desktopRetail / E-Commerce72%25%High mobile traffic, lower mobile conversionEntertainment76%21%Streaming, gaming, social media primaryHealthcare67%30%Symptom lookup predominantly mobileHome Services71%26%"Near me" searches dominateReal Estate63%34%Browse mobile, convert desktop oftenFinance / Banking54%43%Complex transactions still prefer desktopB2B Technology42%55%Work tasks still desktop-dominantProfessional Services48%49%Near split; context-dependent
The industry breakdown reveals why the global average is insufficient guidance for individual website owners. A restaurant website sees 80% mobile traffic — meaning 4 out of 5 visitors are on a phone. A B2B software company sees 42% mobile traffic — less than half its visitors. These businesses have fundamentally different mobile optimization imperatives.
For food service and home services businesses, the mobile optimization question isn't debatable. 70–80% of their audience is literally on a phone, usually in an "intent" moment (looking for somewhere to eat right now, calling a plumber for an emergency). A website that isn't optimized for that experience isn't just underperforming — it's actively failing its primary audience.
Mobile Search Behavior Statistics
BehaviorStatisticSourceMobile share of Google search queries~63%Statista / Google"Near me" mobile search growth (2020–2024)+500%Google TrendsMobile search-to-store visits76% visit within 24 hrsGoogle Consumer InsightsMobile searches for business phone numbers88% result in a call within 24hrsNectafy / BIA AdvisoryMobile voice search usage~27% of all mobile searchesSearch Engine WatchMobile users who abandon non-mobile-friendly sites61%Google / Ipsos
The "near me" search growth statistic (+500% since 2020) is particularly significant for local businesses. When someone searches "plumber near me," "restaurants near me," or "gym near me" on a mobile phone, they're expressing extremely high purchase intent — they want something, they want it nearby, and they want it soon. The conversion value of mobile local search traffic is disproportionately high relative to its raw traffic volume.
The 76% of mobile searchers who visit a local business within 24 hours of their search reinforces this point. Mobile local search is not research — it's often the last step before a transaction. A business that doesn't appear in mobile local search results (because its website isn't mobile-optimized and doesn't rank for local searches) is invisible at the highest-intent moment in the customer journey.
Mobile Performance: Page Speed and Its Consequences
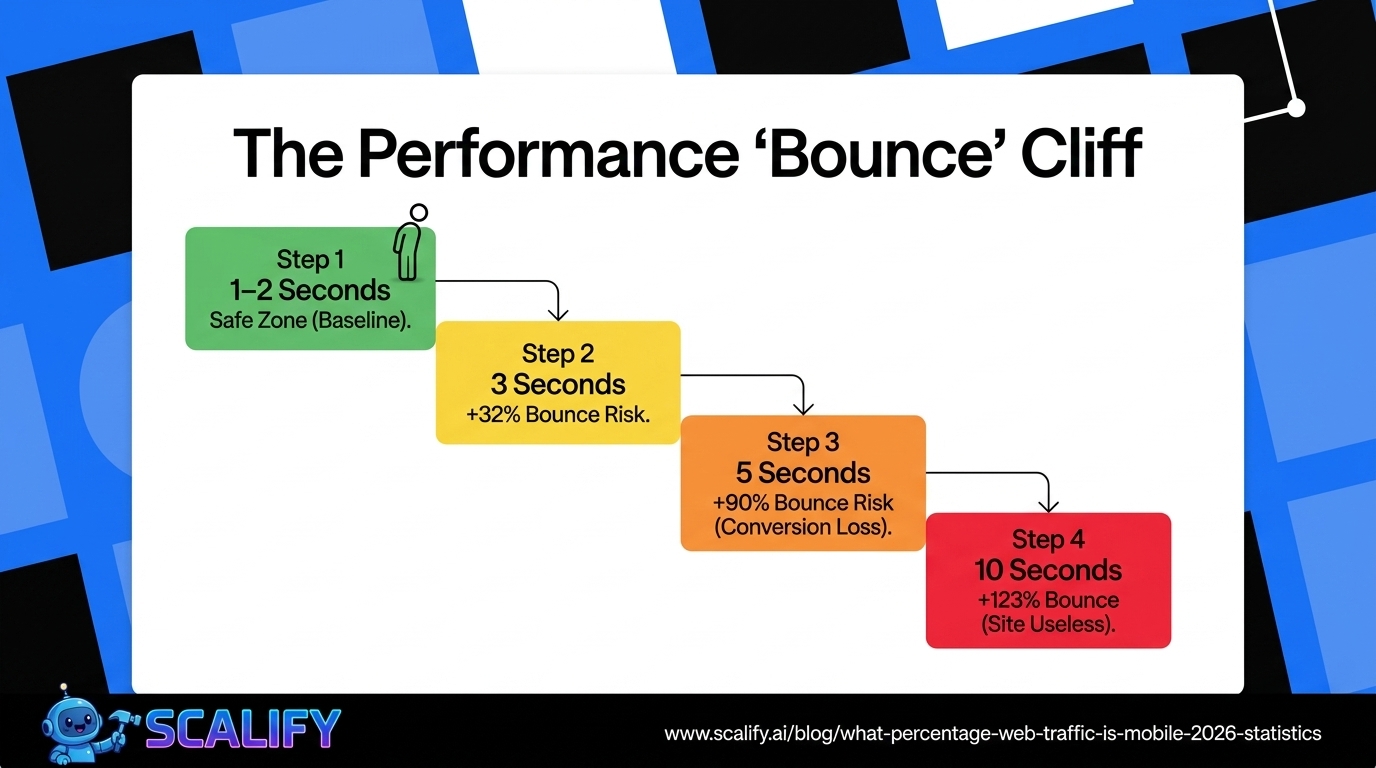
Page Load TimeBounce Rate ImpactConversion Impact1–2 secondsBaseline (lowest bounce)Highest conversion rate3 seconds+32% bounce rate vs. 1 secAcceptable5 seconds+90% bounce rate vs. 1 secSignificant conversion loss7 seconds+113% bounce rate vs. 1 secSevere conversion loss10 seconds+123% bounce rate vs. 1 secSite effectively useless
The average mobile page load time of 8.6 seconds places it squarely in the "severe conversion loss" category according to this data. This average is pulled up significantly by the long tail of poorly-optimized small business websites, e-commerce stores with unoptimized images, and older websites running on shared hosting without performance optimization.
The businesses that suffer most from slow mobile load times are precisely those with the most to gain from mobile traffic — local service businesses, restaurants, retailers. These businesses often have the least technical sophistication to address performance issues, creating a persistent gap between mobile traffic opportunity and mobile traffic capture.
Core Web Vitals on Mobile: Current State
MetricGood Threshold% of Sites Passing (Mobile)% Passing (Desktop)Largest Contentful Paint (LCP)Under 2.5 seconds~46%~68%Interaction to Next Paint (INP)Under 200ms~63%~74%Cumulative Layout Shift (CLS)Under 0.1~71%~78%All Core Web Vitals (mobile)All three "Good"~39%~54%
Only 39% of websites pass all three Core Web Vitals on mobile — compared to 54% on desktop. Google uses Core Web Vitals as ranking signals, meaning that the mobile performance gap is also a mobile search ranking gap. Websites that fail their mobile Core Web Vitals are at a competitive disadvantage in mobile search results, which disproportionately affects them given mobile's 63%+ search query share.
The Mobile Conversion Gap and What Drives It
The persistent gap between mobile traffic share (64%) and mobile conversion rate (2.03% vs desktop's 3.82%) is one of the most discussed problems in digital marketing. It's not fully explained by device preference for complex purchases — research has isolated several specific friction factors:
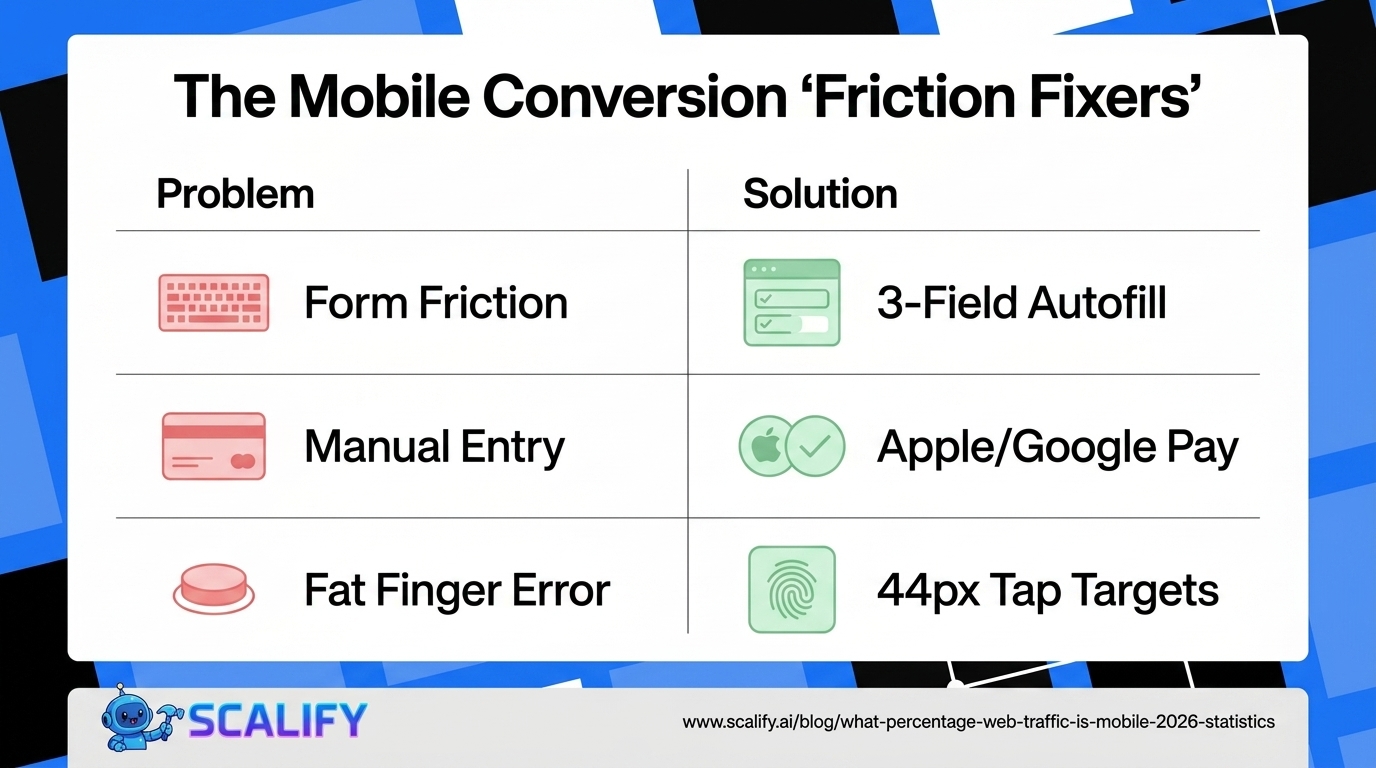
Mobile Conversion Friction FactorImpact on ConversionAddressabilitySmall keyboard → form abandonmentHighHigh — reduce form fields, autofillSlow load times → impatience abandonmentHighHigh — performance optimizationPayment friction (entering card numbers)Very HighHigh — Apple Pay / Google PayTrust signals not visible without scrollingMediumMedium — layout optimizationCTAs too small to tap accuratelyMediumHigh — 44px minimum touch targetBrowsing vs buying mindset on mobileMediumLow — behavioral, not designSession interruption (calls, notifications)MediumLow — environmental
The businesses that have most successfully closed the mobile conversion gap — reducing the difference to 15–20% rather than 47% — have done so primarily through three interventions: streamlining checkout forms to 3–4 fields maximum (vs industry average of 14.88), implementing Apple Pay / Google Pay to eliminate card entry entirely, and ensuring all CTAs meet the recommended 44px minimum tap target size. These are engineering and UX decisions, not marketing decisions — they're the province of the website builder, not the ad buyer.
Mobile Traffic by Operating System
Mobile OSGlobal Mobile Traffic ShareNotesAndroid~72%Dominant globally; varies by marketiOS (iPhone)~27%Dominant in US (57%), UK, Japan, AustraliaOther~1%KaiOS, feature phone browsers
For businesses targeting US, UK, and other English-speaking premium markets, iOS Safari is a disproportionately important browser to optimize for — it represents over half of mobile traffic in these markets despite Android's global dominance. iOS Safari has historically lagged behind Chrome in web platform feature support, particularly for Progressive Web App capabilities, and has specific rendering quirks (viewport height behavior, rubber-band scrolling, form styling restrictions) that require explicit handling in mobile web development.
What This Means: A Framework for Mobile Priority
Given the data, the practical guidance for website owners breaks down by context:
Local businesses (restaurants, services, retail): Your audience is 70–80% mobile and often searching with immediate intent. Mobile optimization is not optional — it's the primary design consideration. Speed, click-to-call, clear address/hours, and mobile-optimized booking/order flows are the highest-ROI investments available to you.
E-commerce businesses: Most of your browsing happens on mobile; most of your purchasing happens on desktop. The strategic challenge is optimizing the mobile discovery and product research experience while ensuring the path to checkout on mobile is as frictionless as possible. Apple Pay / Google Pay integration alone is often worth a 15–25% increase in mobile checkout completion rates.
B2B / Professional services: Your mobile traffic share is lower (42–54%), but that doesn't mean mobile is unimportant — it means that a meaningful portion of your audience is still on mobile and that first impressions on mobile matter for credibility even if conversion happens on desktop. Mobile optimization is still required; the urgency level is somewhat lower than consumer-facing businesses.
Content / media businesses: Your audience is predominantly mobile. Accelerated Mobile Pages (AMP), mobile-first layout, progressive loading, and an excellent reading experience on small screens are table stakes for competing with native news apps and social media for attention.
At Scalify, every website we build is mobile-first — optimized for the 64% of visitors arriving on phones, with Core Web Vitals performance, mobile-appropriate conversion flows, and the speed required to capture high-intent mobile search traffic.
Top 5 Sources


.jpeg)

.jpeg)


78 SW 7th St, Miami, FL 33130


